Picture this: You’re planning a summer camping trip to Algonquin Provincial Park, scrolling through booking sites, wondering which campsite truly delivers those lake views everyone raves about. A decade ago, you’d rely on static park maps and maybe a few forum posts. Today, history interactive maps combine years of visitor data, seasonal patterns, and real-time availability to show you exactly what to expect before you book.
These powerful tools have transformed how Canadian campers plan their adventures. Sarah Chen from Vancouver discovered this firsthand when preparing for her family’s 2026 trip to Pacific Rim National Park. “The interactive map showed me that our target campsite historically fills up by March for July bookings,” she explains. “We also saw patterns showing which loops stayed quieter during school holidays. That historical overlay changed everything about our planning strategy.”
Modern history interactive maps pull together multiple data layers that older static versions simply couldn’t handle. You’ll see past occupancy rates overlaid on current availability, historical weather patterns matched with your travel dates, and aggregated visitor reviews pinpointed to specific campsites. When you’re choosing between two seemingly identical sites at Jasper National Park, knowing that one historically experiences afternoon shade while the other gets full sun until 8 PM makes your decision crystal clear.
The evolution from paper maps to GPS-enabled tools to today’s history-integrated platforms represents more than technological progress. It means fewer disappointed campers arriving at sites that looked perfect online but don’t match their needs. It means understanding that your favourite Banff campground books solid six months ahead every single year, so you can plan accordingly rather than face frustration.
From Paper to Pixels: The Evolution of Camping Maps in Canada
The Paper Map Era: Navigation Before GPS
# The Paper Map Era: Navigation Before GPS
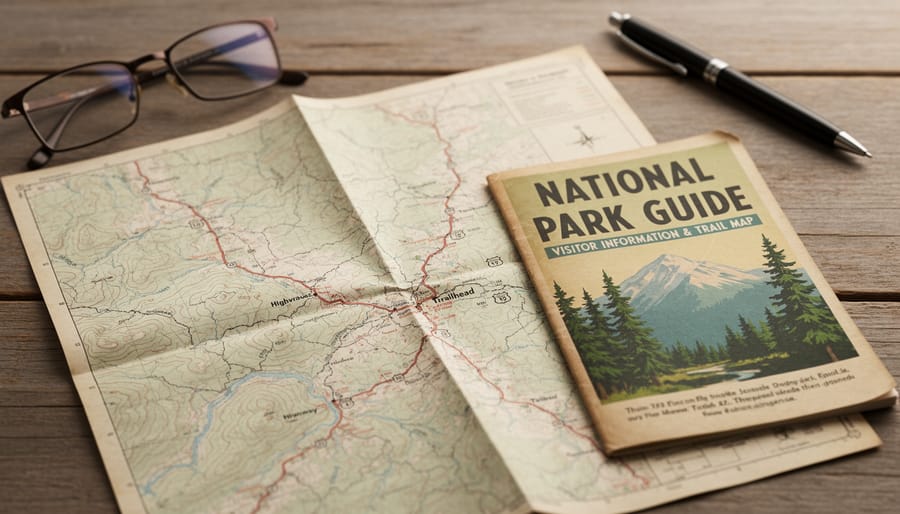
Before smartphones transformed our pockets into navigation centers, Canadian campers relied on folded paper maps that arrived by mail weeks before a trip, often featuring information that was already months out of date. Provincial park brochures promised detailed trail networks and campsite layouts, but what you found on arrival frequently differed from what the map showed. That perfect lakefront site marked on your Ontario Parks map? It might have been closed for erosion control, a detail that wouldn’t make it onto printed materials until the next season’s print run.
The real challenge wasn’t just outdated information. Paper maps couldn’t tell you whether a campground was full, if the access road had washed out after spring floods, or if that scenic viewpoint had been obscured by new tree growth. You drove to your destination hoping for the best, armed with static snapshots of landscapes that changed daily. Many experienced campers kept collections of hand-annotated maps, scribbling notes about actual trail conditions, seasonal flooding zones, and which campsites truly offered the privacy the brochure promised. These personalized archives became invaluable, passed down like family recipes, the closest thing to interactive historical mapping that era offered.
The Digital Revolution Hits the Trail
The late 1990s and early 2000s brought a seismic shift to backcountry navigation. Handheld GPS units became affordable enough for weekend warriors, and websites started hosting downloadable campground coordinates. No more squinting at faded trail markers or debating whether that fork in the logging road matched the drawing in your guidebook.
Digital maps promised precision. You could pinpoint your exact location on a topographic overlay, mark waypoints for that remote fishing spot your uncle mentioned, and upload entire route libraries before leaving cell service. Provincial park websites began posting PDF maps with campground layouts, letting families study the distance between sites and bathrooms from their home computers.
But here’s what those early tools couldn’t tell you: whether Site 47 at your dream destination was actually available next weekend. You could see every trail junction and elevation gain, yet you’d still arrive at the gate only to learn the lakefront sites had been booked solid for months. GPS showed you where campsites existed, not which ones you could actually claim. The maps were digital, sure, but the availability information remained stuck in the phone-and-pray reservation system. That gap between knowing where to go and knowing what was open would take another technological leap to close.
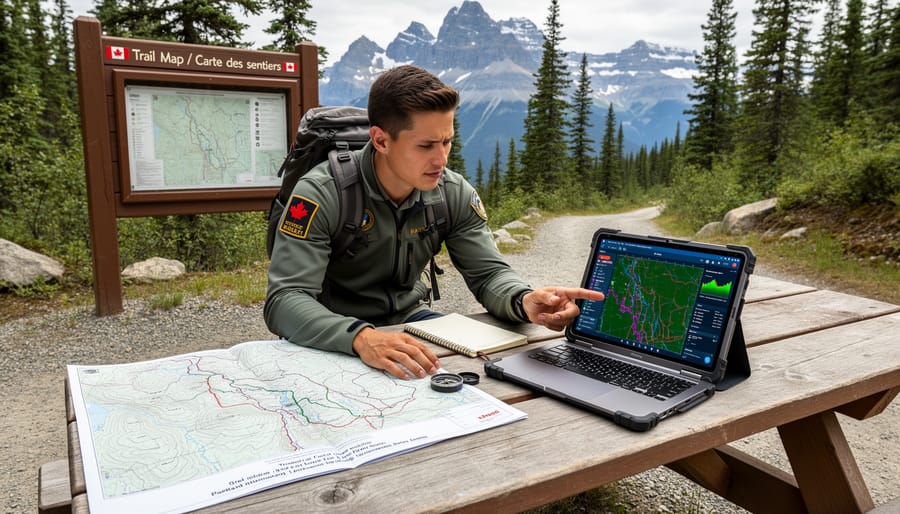
What Makes Today’s History Interactive Maps Different
Real-Time Availability Meets Historical Data
The real power of modern camping platforms emerges when historical booking data combines with live availability feeds. Instead of simply showing which sites are vacant right now, these systems analyze years of reservation patterns to predict when openings might appear. If a campground consistently shows last-minute cancellations on Friday afternoons in July, or if midweek spots open up after long weekends, the map learns these rhythms and surfaces them to users.
This predictive approach mirrors techniques hospitality researchers use for predicting future hotel demand but applied to Canadian camping contexts where seasonal variations matter intensely. A campground near Banff might show 100% booked for August long weekend when you check in May, yet historical data reveals that 15-20% of reservations typically cancel within two weeks of arrival. The interactive map flags this pattern, suggests setting an availability alert, and even recommends backup dates when similar conditions historically guaranteed open spots.
You stop planning around what’s available today and start making decisions based on what patterns suggest will become available tomorrow.
Interactive Features That Learn From the Past
Modern interactive camping maps have evolved far beyond simple pin drops on a digital canvas. The most sophisticated platforms now feature clickable campground markers that reveal layered historical data when you hover or tap. Each marker displays not just current availability, but a timeline of occupancy rates from previous years, showing you exactly when sites typically fill up or open unexpectedly.
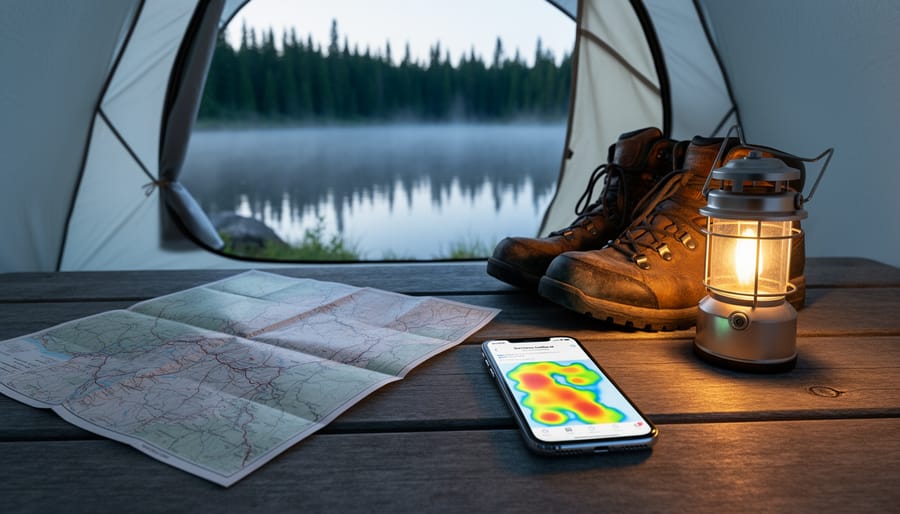
Seasonal trend indicators use color-coded overlays to visualize booking patterns across months and years. A campground marker might glow red during traditional peak weeks but shift to amber or green during historically quieter periods, even within the same summer season. These visual cues help you spot booking windows that casual planners miss entirely.
The most powerful feature combines user-generated historical reviews with booking data. When you click a specific site, you see not just star ratings but chronological feedback organized by season and weather conditions. Past visitors describe their July experiences separately from their September stays, revealing how drastically conditions change. These reviews guide trip planning by highlighting recurring issues like mosquito seasons, wildflower blooms, or lake warming patterns that repeat reliably each year.
Some platforms now offer historical weather overlays showing rainfall accumulation, temperature ranges, and daylight hours from past years at specific campgrounds. Toggle these layers on, and you can compare whether that coastal BC site you love typically experiences morning fog in August or clear skies in early September, based on years of aggregated data rather than guesswork.
How Canadian Forest Camping Uses History Interactive Maps

Finding Hidden Patterns in Booking History
Sarah Martinez had been trying to book a lakeside site at Grundy Lake Provincial Park in Ontario for three consecutive summers without luck. Every time she checked in spring, the prime waterfront spots were already marked as unavailable through September. Like many campers, she assumed the most coveted sites were impossible to get unless you booked exactly at midnight when reservations opened.
Then she discovered Canadian Forest Camping’s interactive history maps feature. Instead of just viewing current availability, she pulled up the historical occupancy overlay for her target campground. The data revealed something surprising: while weekends showed solid red (fully booked) from May through August, mid-week periods in late June had consistent gaps where lakeside sites suddenly became available.
Sarah learned these weren’t last-minute cancellations appearing randomly. The pattern repeated across three years of booking history. Families who reserved for full weeks often checked out Wednesday or Thursday rather than staying through Friday, creating a predictable window. By monitoring the historical data and setting an alert for those specific days, she secured site 47, a premium lakefront location with a sunset view, for a Wednesday arrival in late June 2026.
The historical pattern held true. When Sarah arrived, the neighbouring sites were empty for one night before weekend campers filled them. Without the booking history maps showing her this recurring pattern, she would never have known to look.
Seasonal Insights That Save Your Trip
Canada’s climate varies wildly from coast to coast, and what works for camping in July in Ontario might be disastrous timing in the Yukon. Historical weather data layered onto interactive maps reveals patterns that can make or break your trip. In Algonquin Park, for instance, past temperature records show that mid-September offers surprisingly warm days with far fewer blackflies than the peak summer months, while historical occupancy data confirms lighter crowds. Interactive maps pull together years of this information, letting you spot the sweet spot between comfortable weather and available campsites.
Wildlife activity records add another crucial layer. Historical grizzly sighting data in Alberta’s backcountry shows seasonal movement patterns, helping you choose safer periods for certain trails. Bird migration records indicate when you’re most likely to catch specific species at Canadian coastal campgrounds. These aren’t vague generalities but actual logged observations from park wardens and fellow campers spanning multiple years.
Past availability patterns reveal surprising opportunities too. The maps might show that a popular BC coastal campground traditionally sees a mid-week lull in late August despite perfect weather, simply because school schedules drive booking behavior. In Quebec’s Parc national de la Jacques-Cartier, historical data demonstrates that weekday bookings in early October drop sharply even though the fall colours peak then, creating openings that careful planners can exploit. This accumulated knowledge transforms guesswork into strategy, letting you time your adventure when conditions align perfectly with your preferences.
Practical Benefits of History-Informed Interactive Mapping
The real power of these mapping tools becomes clear when you start planning trips around actual data rather than guesswork. Instead of calling campgrounds repeatedly or showing up to find “No Vacancy” signs, you’re working with patterns drawn from years of bookings, weather events, and visitor experiences across Canadian parks.
Crowd avoidance ranks high on most campers’ wish lists, and historical occupancy overlays make this genuinely achievable. When you hover over a campground in Ontario’s Kawartha Highlands during the August long weekend, the map shows not just current availability but how quickly sites have filled in previous years. You’ll notice that while weekends book solid three months out, midweek spots often open up even a week before arrival. One family from Toronto used this insight to shift their trip by two days, securing a waterfront site at Silent Lake that would have been impossible on their original weekend dates.
Weather-related closure predictions save trips from turning into disappointments. By layering historical weather data with park closure records, these tools flag high-risk periods. Planning a June trip to Newfoundland’s Gros Morne? The map reveals that early-season washouts closed coastal campgrounds during the first two weeks of June in three of the past five years, but conditions stabilized reliably by late June. This kind of pattern recognition helps you time trips when parks are actually accessible.
Wildlife viewing becomes strategic rather than lucky. Historical sighting data aggregated from past campers shows migration patterns and seasonal concentrations. Jasper’s elk rutting season peaks predictably in late September, while Churchill River’s beluga whales gather most reliably in July through early August. The map doesn’t guarantee wildlife encounters, but it dramatically improves your odds by showing when and where animals have consistently appeared.
Aggregated past reviews create a different kind of historical value. When 200 campers over three summers mention mosquitoes peaking in specific weeks at Quetico Provincial Park, that’s actionable intelligence. You pack extra bug spray, shift your dates slightly, or choose a windier island site where insects are less intense.
Making the Most of Interactive Map Features in 2026
Modern history interactive maps pack sophisticated features that can feel overwhelming at first glance. But once you know where to look and which tools to prioritize, these platforms transform from complex interfaces into your most reliable camping companion. Here’s how to leverage every feature effectively for your 2026 camping plans.
- Start broad by selecting your target region on the map, zoom into specific provincial parks, conservation areas, or wilderness zones across Canada where you’re considering camping.
- Apply historical data filters to view past occupancy patterns for your chosen timeframe. Most platforms let you overlay previous years’ booking data, showing which weeks traditionally see lighter traffic.
- Analyze seasonal trend indicators by clicking individual campgrounds. Look for color-coded heat maps showing peak versus off-peak periods based on years of accumulated data.
- Cross-reference with real-time availability to spot unexpected openings that contradict historical patterns, these often signal cancellations or newly added sites.
- Save promising campgrounds to your favorites list, tagging them with personal notes about what appealed to you from the historical reviews or availability windows.
- Set up smart alerts that notify you when historically popular sites show availability during your preferred dates, or when prices drop below historical averages for specific locations.
Pay special attention to the review timeline feature that many platforms now offer. Instead of reading reviews chronologically, filter them by season or specific years to understand how conditions, wildlife activity, and crowding levels have shifted over time at your chosen campground. A site that received complaints about overcrowding three summers ago might have implemented capacity limits that completely changed the experience.
The map’s layering system lets you toggle between different data sets, historical weather patterns, past wildlife sightings, trail condition reports from previous seasons, and booking density. Don’t try viewing everything simultaneously. Instead, turn layers on and off systematically as you narrow your choices, building a complete picture of each potential campsite through its accumulated history.
History interactive maps have fundamentally changed how Canadians experience the wilderness. These tools give us something previous generations of campers never had: the ability to see both the present and the past at once, making smarter decisions about where and when to explore. When you can spot historical booking patterns showing that a “full” campground typically has cancellations three days before arrival, or identify which weeks mosquitoes peak at your favorite lake, you’re not just using technology, you’re drawing on the collective wisdom of thousands of campers who came before you.
This combination of real-time availability and historical insight makes camping more accessible to families planning their first trip and helps experienced adventurers discover new corners of Canada’s vast wilderness. Perhaps most importantly, better-informed planning means less wasted fuel driving to full campgrounds, fewer disappointed families, and more respectful use of our natural spaces.
The best camping experiences still happen when you disconnect from screens and connect with nature. But getting there? That’s where these maps shine, turning the frustration of trip planning into confident preparation that lets you focus on what matters: the crackle of your campfire and the stars overhead.